5 Big Ways LGBTQ Wedding Planning Has Changed in 5 Short Years
By
This article was written by WeddingPro Educator, Kathryn Hamm.
Five years ago, the Supreme Court of the United States (SCOTUS) decided that New York resident Edie Windsor’s out-of-state marriage (she married Thea Spyer in Canada in 2007) would be recognized in New York, where same-sex marriage had been legally recognized since 2011.
This landmark decision immediately opened the door for the many same-sex couples who wished to seek legal partnership recognition but could not do so in their home states, and ultimately paved the way toward SCOTUS’ Obergefell decision in 2015, which embraced marriage equality nationwide. Those legal shifts, though taking place in courtrooms, ultimately had a significant impact on the wedding market and the choices of engaged LGBTQ couples.
Time Flies
Prior to 2013, LGBTQ weddings were smaller, had older brides and grooms, were more custom than traditional in design, and the couples themselves tended to pay for the ceremony and celebration. After 2005, when Massachusetts legalized marriage and others followed, some couples were planning legal elopements to travel to jurisdictions for a marriage certificate, but many were choosing to have non-legally-recognized ceremonies and otherwise share their commitments more publicly.
Though I have a file full of instructive anecdotes and isolated data snapshots to explain what was happening in the market back in the day, it was 2013 that offered a turning point for enough data to explain how the same-sex wedding market has been changing with legal recognition. The result? With the spread of marriage equality recognition, we could see in real time how LGBTQ weddings were beginning to assimilate into the “mainstream” market and, conversely, how non-LGBTQ weddings had begun to adopt LGBTQ innovation more frequently, including trends like ‘pop up’ or micro-weddings, blended wedding parties, color variety in wedding parties, laypeople as officiants, and more.
Newlywed Report: LGBTQ Market Analysis
Over the past few years, our WedInights team has issued its annual Newlywed Report, which is chock full of insights about today’s couples, gleaned from the answers from almost 18,000 participants (the most comprehensive and rigorous report in the industry). This essential tool is important to help wedding professionals stay up-to-date on the latest trends, particularly when it comes to same-sex couples because the LGBTQ market segment has been in a state of constant growth and flux for the past decade. What was true five years ago is not necessarily true today. Now that the U.S. is celebrating three years of marriage equality nationwide, however, trends within the LGBTQ market segment are beginning to stabilize, making it easier for wedding professionals to make thoughtful decisions about their marketing plans and service offerings for all couples.
‘What was true five years ago is not necessarily true today.’
Before I highlight a few key shifts in lesbian and gay wedding trends, it’s important to note that this analysis draws primarily from the Newlywed Reports (2015-2018) and the Trends & Traditions Surveys, which offer a direct year-over-year comparison of questions. It also references trends revealed in the 2015 Contemporary Couples Report (by us, GayWeddings, Community Marketing, Inc and the Gay Wedding Institute) of those who married in 2014, and a related report, Same-Sex Couples: Weddings & Engagements (by Community Marketing, Inc and the Gay Wedding Institute) of couples surveyed in 2013, but who may have celebrated a union or become engaged at any time in the previous years.
Five Big Changes for Same-Sex Couples
#1 Parents are stepping up. And in?
More than ever, same-sex couples are receiving help paying for their weddings. Five years ago, a strong majority of same-sex couples (79% in 2013) reported paying for all or most of the wedding themselves, compared to 2017 where that number has dropped significantly to 59% of couples. This shift tells us that more parents (and extended family) are participating in and supporting their kids’ LGBTQ weddings, and, as a result, the overall wedding spend is increasing as more vendors are hired, more guests are invited, and as LGBTQ couples have shifted away from practical and often quickly planned legal elopements to a more typical engagement and wedding planning process.
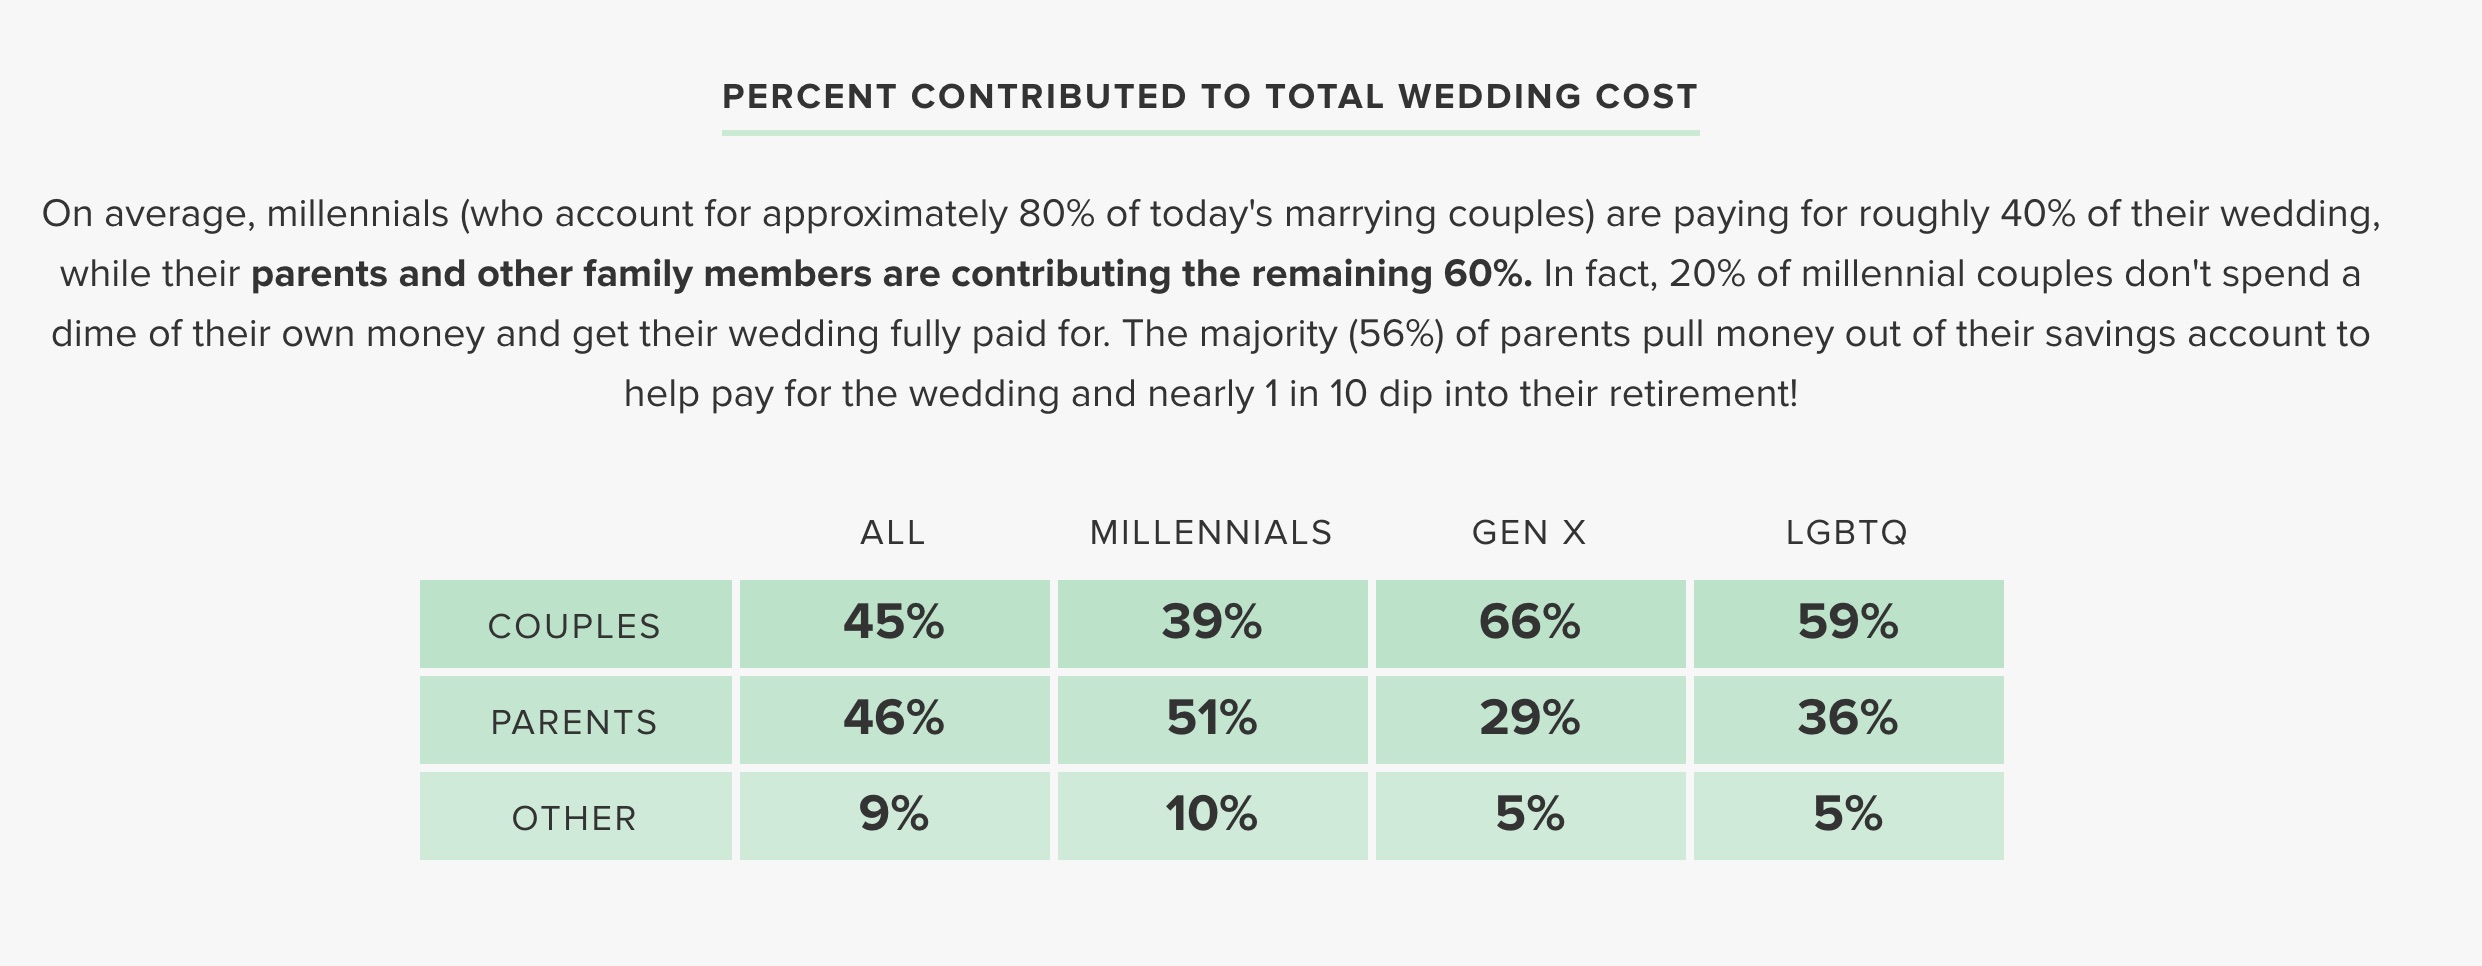
This also means that identifying the decision-maker in the booking process may be shifting now that a couple’s parents may have more financial investment in the wedding and, as such, an expectation around decision-making.
#2 Growth of the guestlist
The growth of the guestlist at gay and lesbian weddings is a direct result of more couples coming out, more couples choosing to marry, and more couples feeling comfortable celebrating with a broader circle of families, friends, and co-workers. It’s also a function of being able to get legally married in one’s home state and having the chance to plan accordingly. In fact, the 2015 Survey of Contemporary Couples revealed that 79% of same-sex couples were planning a wedding ceremony and reception, almost doubling the result (43%) of couples surveyed previously (Same-Sex Couples: Weddings & Engagements, 2013).
- Prior to 2013, the size of the average guestlist was 65
- In 2014, the average size was 80
- In 2015 and 2016: 100
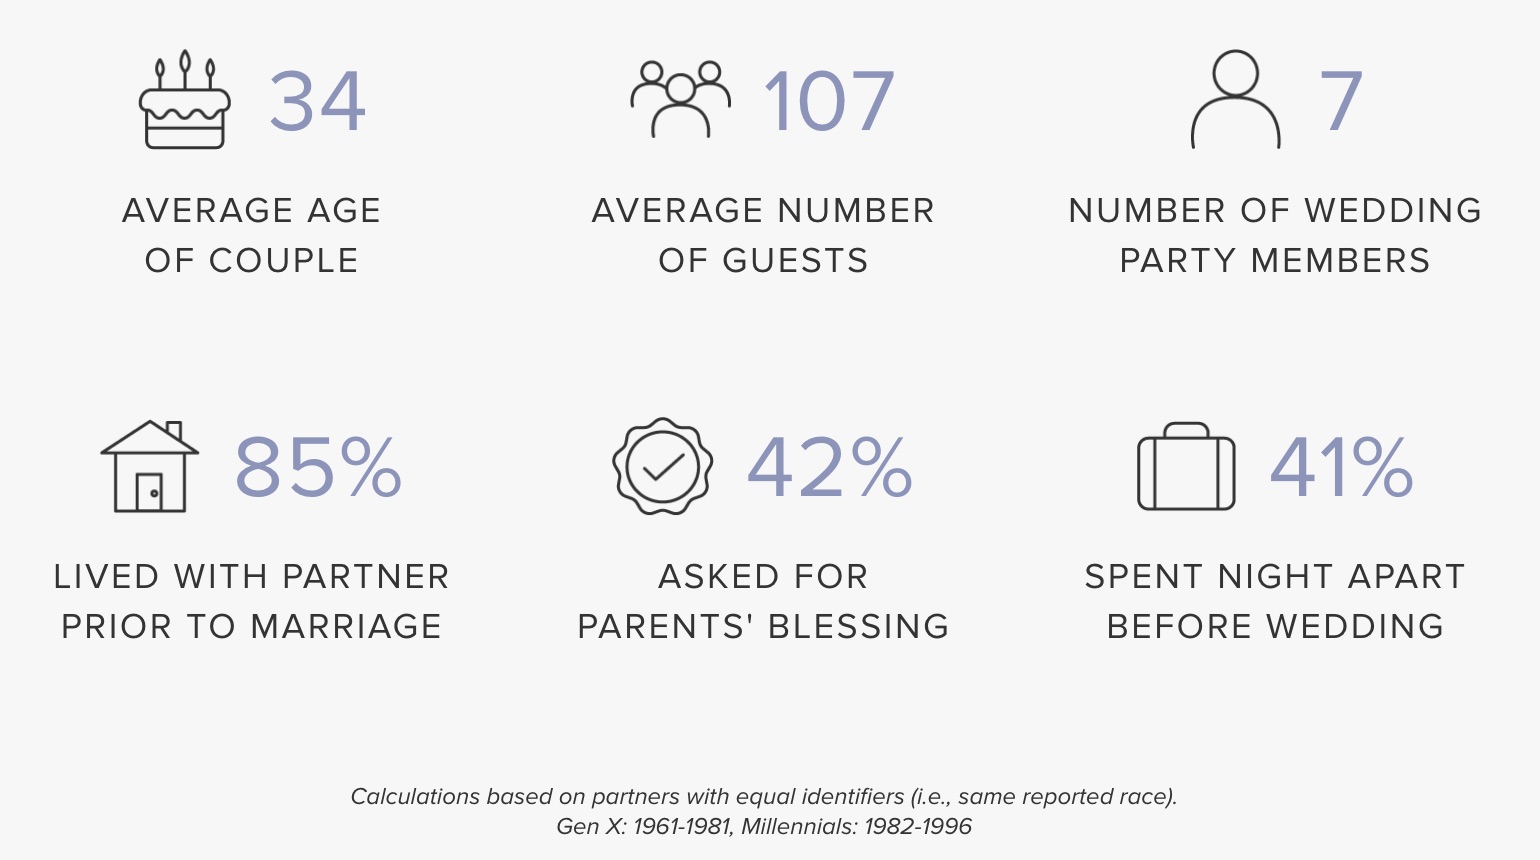
- In 2017: 107 (which still lags behind non-LGBTQ couples average guestlist size of 127)
In sum, having both a ceremony and a reception is a relatively new development for a majority of same-sex couples and marks a major shift with clear planning and budgeting implications and has had a direct impact on the growth in size of the average guestlist.
#3 Size of wedding party
As same-sex weddings have grown in size, so, too, has the supporting cast. In 2013, 63% of same-sex couples reported that they had anywhere from 0 to 3 persons in their wedding party. Yes, you are hearing that correctly. Five years ago, same-sex couples had 3 or fewer people standing up with them as witnesses. Today, the average wedding party size for same-sex couples is 7, compared to 9 for heterosexual couples.
More moving parts, more guests and bigger wedding parties are just another indicator that same-sex couples are following the structural rules of traditional wedding planning compared to the highly personalized, more modestly-sized ceremonies from years’ past.
#4 Blended Wedding Party
There is perhaps no better example of a wedding custom than the wedding party in order to illustrate not only the difference in the willingness of same-sex couples to break with tradition, but also an impressive example of how gay weddings have influenced straight weddings.
In our 2016 Trends and Traditions Report, only 14% of LGBTQ couples reported dividing their wedding parties based on gender. That is, guys on one side and gals on the other. Same-sex couples have always tended to blend their wedding parties, asking their closest supporters to stand with them, regardless of gender and often in whatever attire they choose (eg women wearing pants and dresses to suit). What’s most remarkable is to understand how this repurposed vision of a wedding party for same-sex couples has dramatically influenced the choices of opposite-sex couples in a short amount of time. Seventy-four (74%) of straight couples divided their wedding parties by gender in 2015, but the needle moved to 69% in 2016 and, more recently, dropped to 60% in 2017.
‘What’s most remarkable is to understand how this repurposed vision of a wedding party for same-sex couples has dramatically influenced the choices of opposite-sex couples in a short amount of time.’
As same-sex couples are assimilated into the mainstream market, it’s clear that there has been a two-way street of influence, which has been amplified by Millennial couples, who choose rituals and make planning choices that are highly customized to their preferences.
#5 Age of the couple
In 2014, Jennifer Senior, then a writer for the New York Magazine, noted that one-third of LGBTQ newlyweds were over 50. Our Newlywed Report revealed that the average age of same-sex couples who had married in 2015 and 2016 was 35 (with a smidge of variation in age between gay grooms and lesbian brides). In 2017, the age dropped to 34. Today, LGBTQ couples still skew a bit older than non-LGBTQ couples (the average age for heterosexual couples in 2017 was 32), but the shrinking gap reveals not only how opposite-sex couples are getting married a few years later in life, but also how same-sex couples are getting younger.
This is just one more example of how the engagement and wedding planning trajectory for same-sex couples is assimilating to match the typical relationship trajectory for heterosexual couples: start dating, (perhaps cohabitate), get engaged, and get married. With more open acceptance of LGBTQ individuals and couples, one’s sexual orientation is no longer a factor in one’s interest in and access to marriage and wedding planning services.
 This post was written by Kathryn Hamm, WeddingPro Educator and Diversity and Inclusion Specialist. Kathryn is also co-author of the groundbreaking book, The New Art of Capturing Love: The Essential Guide to Lesbian and Gay Wedding Photography. Follow her on Twitter @madebykathryn.
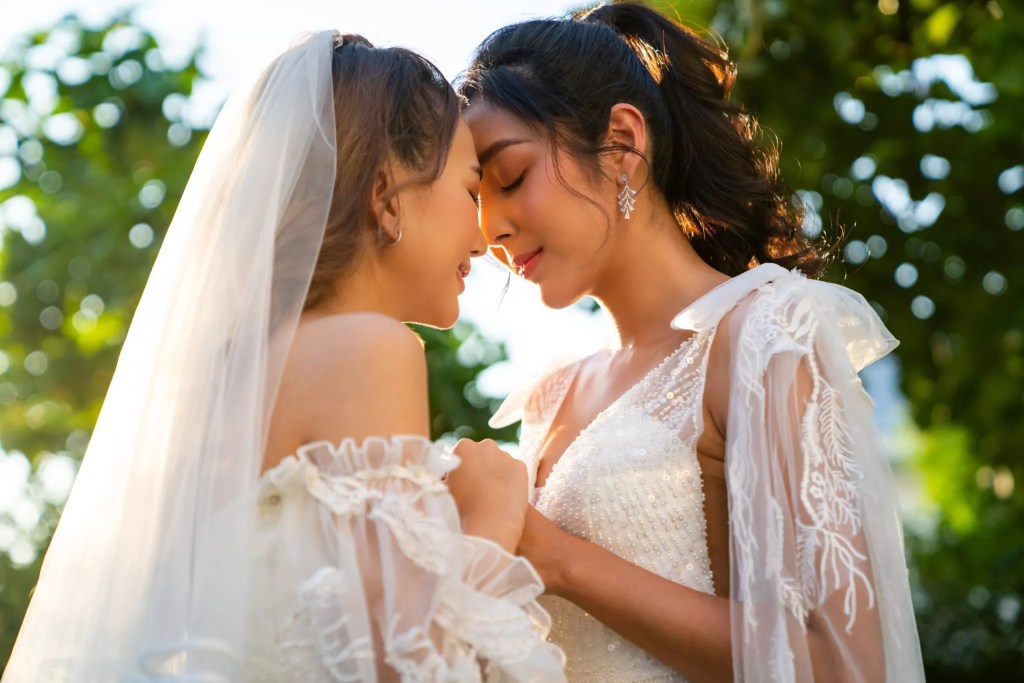
Photo by B. Jones Photography
Let's grow your business together!
Start advertising on The Knot and WeddingWire, the top two wedding planning platforms.